Rates of Change
Contextualizing Climate Change
Welcome to Polymathic Being, a place to explore counterintuitive insights across multiple domains. These essays take common topics and explore them from different perspectives and disciplines, to uncover unique insights and solutions.
Today's topic continues the exploration into our climate that we started with The Climate is Changing and now looks at how extreme our rates of climate change are today compared to the geological record. The goal is to better understand our current climate changes to inform effective action that increases human flourishing.
Intro
I’m an ardent environmental steward and my singular goal is to align human living with environmental health that allows both to thrive. I want less pollution, less animal extinction, less unconstrained resource extraction, and a healthy climate. As I dig into the data for what we are told we must do, too often I find a scientific reality that’s the opposite of my goals. The current fear over global temperature increases is a great example to study.
One of the best arguments I’ve heard about the severity of our current global warming was that the rate of change is unprecedented compared to warming and cooling trends across our planet’s history. The rate of change argument was heavily anchored in the infamous Hockey Stick Graph which sparked a great deal of controversy within the climate science world:
It shows a dramatic rise in temperature well above normal for the past 1,000 years. It’s not completely wrong because we are emerging from a literal ice age that ended just 11,000 years ago. As we captured in The Climate is Changing:
We are currently not very far into an inter-glacial warm period and glaciers are continuing to recede. But even within this warming period, climate scientists have identified four cold and warm cycles during the past 2,000 years. These include the Roman Warm Period (c. 50 - c. 200), and the Dark Ages Cold Period (c. 400 - c. 800, the Medieval Warm Period (c. 800 - c. 1200), and the aforementioned Little Ice (c. 1300 - c. 1800).
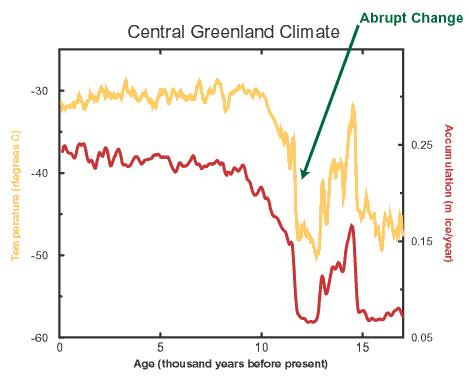
But let’s step back a moment and consider that spike of change captured in the Hockey Stick Graph. The entire spike represents an increase in average global surface temperatures of roughly 1°C over 150 years. Let’s compare that to the changes right at the end of the last Ice Age where we see major shifts of temperature of nearly 20°C.
This volatility is part of a longer and sustained cycle called Dansgaard–Oeschger events (often abbreviated D–O events). These are rapid climate fluctuations that occurred 25 times during the end of the last glacial period and are described as:
In the Northern Hemisphere, they take the form of rapid warming episodes, typically in a matter of decades, each followed by gradual cooling over a longer period. For example, about 11,500 years ago, averaged annual temperatures on the Greenland ice sheet increased by around 8°C over 40 years, in three steps of five years, where a 5°C change over 30–40 years is more common.
Let’s restate this. Less than 12,000 years ago the Earth saw warming of 8°C over 40 years against the more typical 5°C change over 30–40 years and currently the exponential curve of the Hockey Stick is 1°C over 150 years.
8°C over 40 years vs. 1°C over 150 years.
This volatility goes back millions of years and includes Milankovitch cycles where changes in the Earth's tilt, rotation, and orbit create cyclical variation in the climate over thousands of years. The only thing that’s consistent about Earth’s temperatures is that they aren’t consistent and often much more severe than currently.

Adding further complexity is an event called the Paleocene Eocene Thermal Maximum which involved a dramatic spike in temperature of 14°C higher than preidustrial temps and atmospheric CO2 levels doubling and possibly quadrupling up to 3500 ppm. However, Earth, overall, thrived with our polar regions heavily forested. CO2 was balanced during the Eocene at 1600ppm, aligning with the maximum plant growth of 1200ppm of CO2. (as comparison we are now just over 400ppm) Fossils of tropical plant life from that time are found in the Arctic, Greenland, and Alaska.
It was cataclysmic to some with the extinction of several deep-sea species as ocean temps increased. The coastlines were also dramatically different as the sea level was upwards of 150 meters higher than today. However, this cataclysm pushed evolution forward, resulting in the emergence of our modern mammalian ancestors. If it weren’t for this dramatic climate change, we humans likely wouldn’t exist today.
A brief aside on CO2. As you likely noted in the temperature data, CO2 is equally as volatile in its rates of change and typically much higher than currently for the vast majority of time over the past 50 million years. Even more interesting is that research on atmospheric CO2, measuring the carbon 14 isotopes which differ between burning fossil fuels and natural sources identified that:
[T]he percentage of the total CO2 due to the use of fossil fuels from 1750 to 2018 increased from 0% in 1750 to 12% in 2018, much too low to be the cause of global warming.
This means that 88% of the increase of CO2 in our atmosphere since 1750 is coming from non-human activity. The rate of change in CO2 maps to temperature and is driven by natural cycles that we also see throughout the longer geological history.
Summary
The argument for our current climate change being more severe than at any other time in history was a compelling argument but quickly fell apart on a cursory view of the data. We return to the question asked in The Climate is Changing on why we picked the temperature and CO2 baselines we did.
This investigation highlights the hubris humans exhibit in expecting mastery over nature while understanding very little of it. Our ignorance also overlooks the powerful force of adaptation and natural selection that climate change drives. Ironically, our hubris in thinking we can stop it is typically tied to a belief that things shouldn’t change. Nature is adept at proving otherwise, typically at the expense of those species that failed to adapt to those changes.
The world is dynamic, often chaotic, and certainly not something we understand well. That doesn’t stop us from creating narratives that neatly smooth over these inconvenient truths. We should certainly be stewards of our environment but trying to freeze nature to an arbitrary point in time means we overlook so many opportunities for adaptation and evolution that it beggars the imagination. We can do better and that starts with a better understanding of how nature operates.
More on the consequences of this mindset can be found here:
For an investigation into the greenest energy available check out this essay:
If you’re curious why we are panicked by threats in the future, this one is for you.
Enjoyed this post? Hit the ❤️ button above or below because it helps more people discover Substacks like this one and that’s a great thing. Also please share here or in your network to help us grow.
Polymathic Being is a reader-supported publication. Becoming a paid member keeps these essays open for everyone. Hurry and grab 20% off an annual subscription. That’s $24 a year or $2 a month. It’s just 50¢ an essay and makes a big difference.
Check Out Refind: Brain food, delivered daily
Every day, Refind analyzes thousands of articles and sends you only the best, tailored to your interests. Loved by 503,336 curious minds. Subscribe Here
Further Reading from Authors I Appreciate
I highly recommend the following Substacks for their great content and complementary explorations of topics that Polymathic Being shares.
Goatfury Writes All-around great daily essays
Never Stop Learning Insightful Life Tips and Tricks
Cyborgs Writing Highly useful insights into using AI for writing
Educating AI Integrating AI into education
Mostly Harmless Ideas Computer Science for Everyone


We think we're riding through space on an inert gob of rock. But it's a living thing, in a way, with a lifecycle longer than we can imagine. "What it was like in granddad's day," isn't a useful metric for normal. Climatic swings and counterswings have been going on since before humans existed. Thanks for bringing some perspective to the discussion.
The one, tiny thing I don’t understand is this: Climate scientists know all of this. All the data you cite — climate scientists put all of that together, did all the work and research to come up with it. And yet they’re in near-universal accord that human-caused global warming is a significant thing, not a correlation-causation fallacy. Why? You mentioned hubris… Eh, I don’t buy that. One person can be wrong about what the science says on account of psychology, a handful of people can be wrong… but the overwhelming majority of the people who have devoted their careers to this field? No, hubris isn’t the explanation. So, why?